
A COMPREHENSIVE GUIDE TO
Net Promoter Score (NPS)
A metric measuring customers’ propensity to advocate for a brand, which, in turn, serves as a proxy for customer happiness and, eventually, business growth.
Dive deeper
Table of Contents
What is Net Promoter Score?
Net Promoter Score, or NPS, is a metric companies use to measure their customers’ propensity to advocate for the brand, which, in turn, serves as a proxy for customer happiness and, eventually, business growth.
Because NPS reduces such a large question to a single-question (“How likely is it that you’d recommend this brand to a friend or colleague?”) survey with an answer limited to an 11-point (0-10) scale, many business leaders debate its merits. Despite grievances around oversimplification, NPS has emerged as one of the most pervasive KPIs for customer satisfaction in business today.
How to calculate Net Promoter Score?
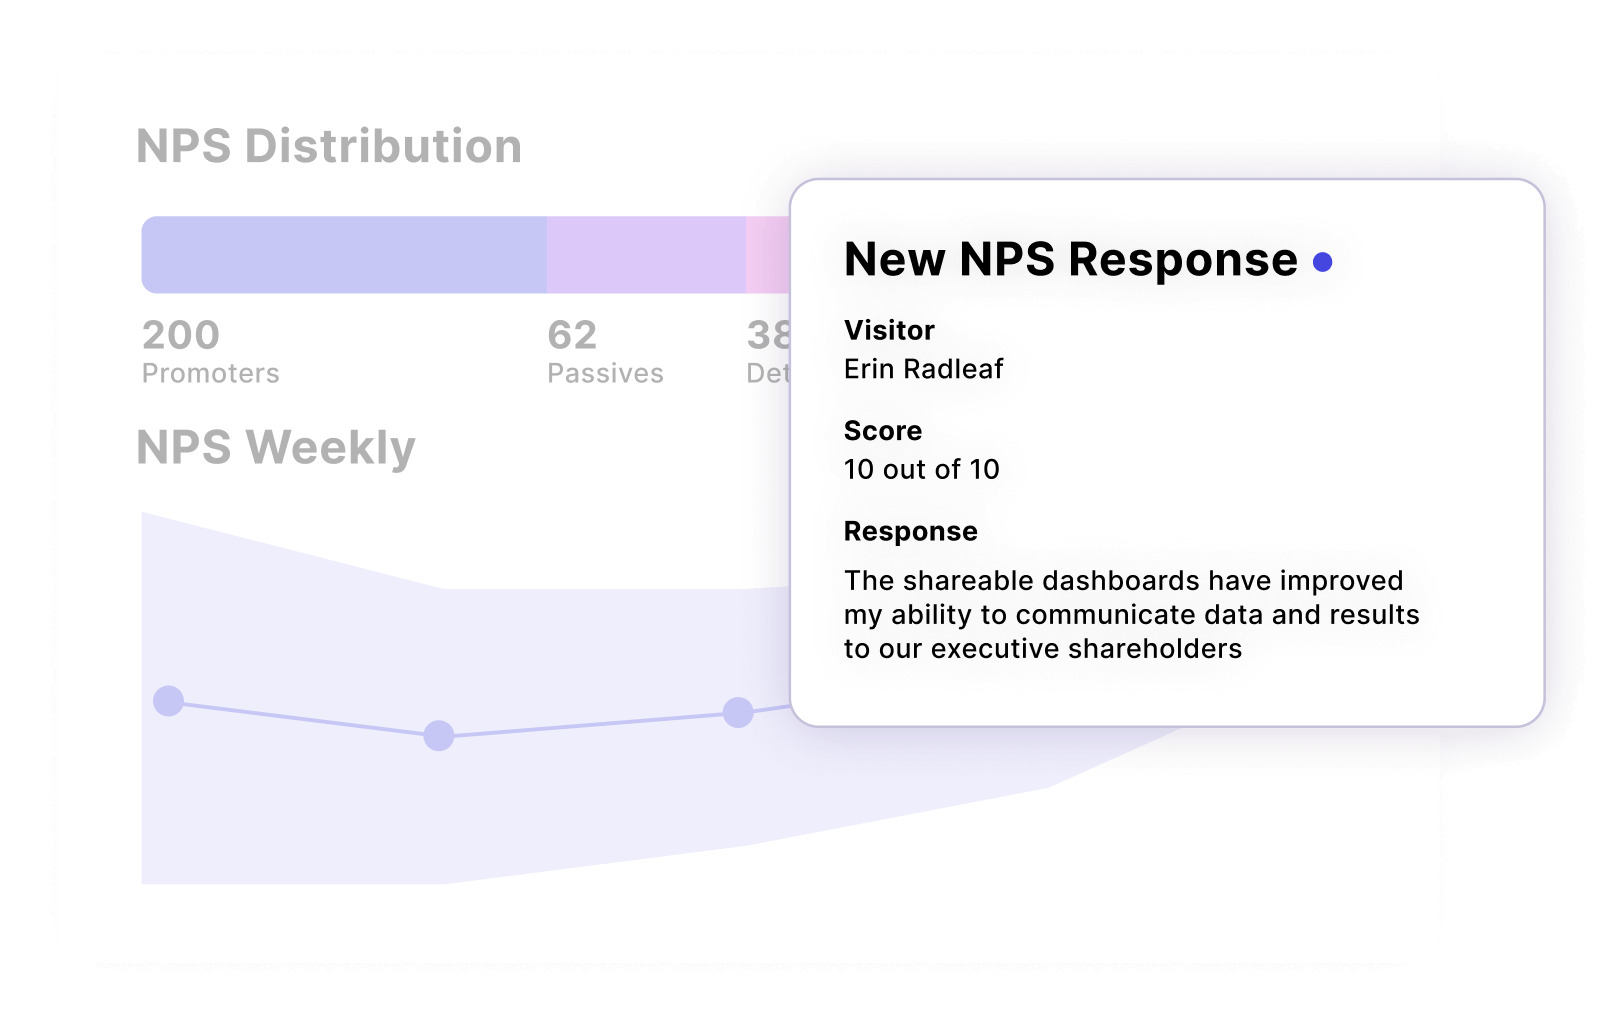
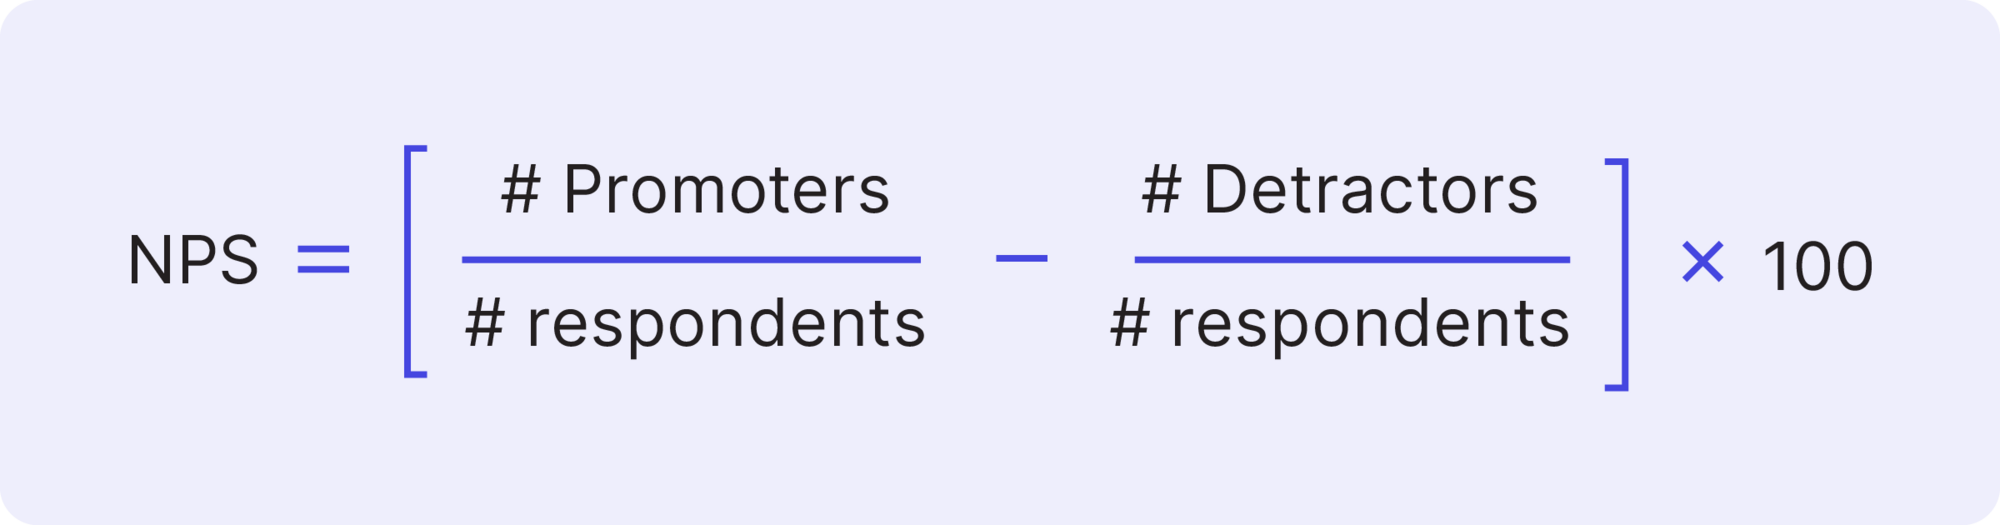
The calculation is predictably simple. A company conducts an NPS survey among its customers. It marks scores of 9 or 10 as “Promotors,” 7 or 8 as “Passives,” and 0 through 6 as “Detractors.” Then it subtracts the percentage of Detractors from the percentage of Promoters to produce its Net Promoter Score.
Here’s a Net Promoter Score formula:
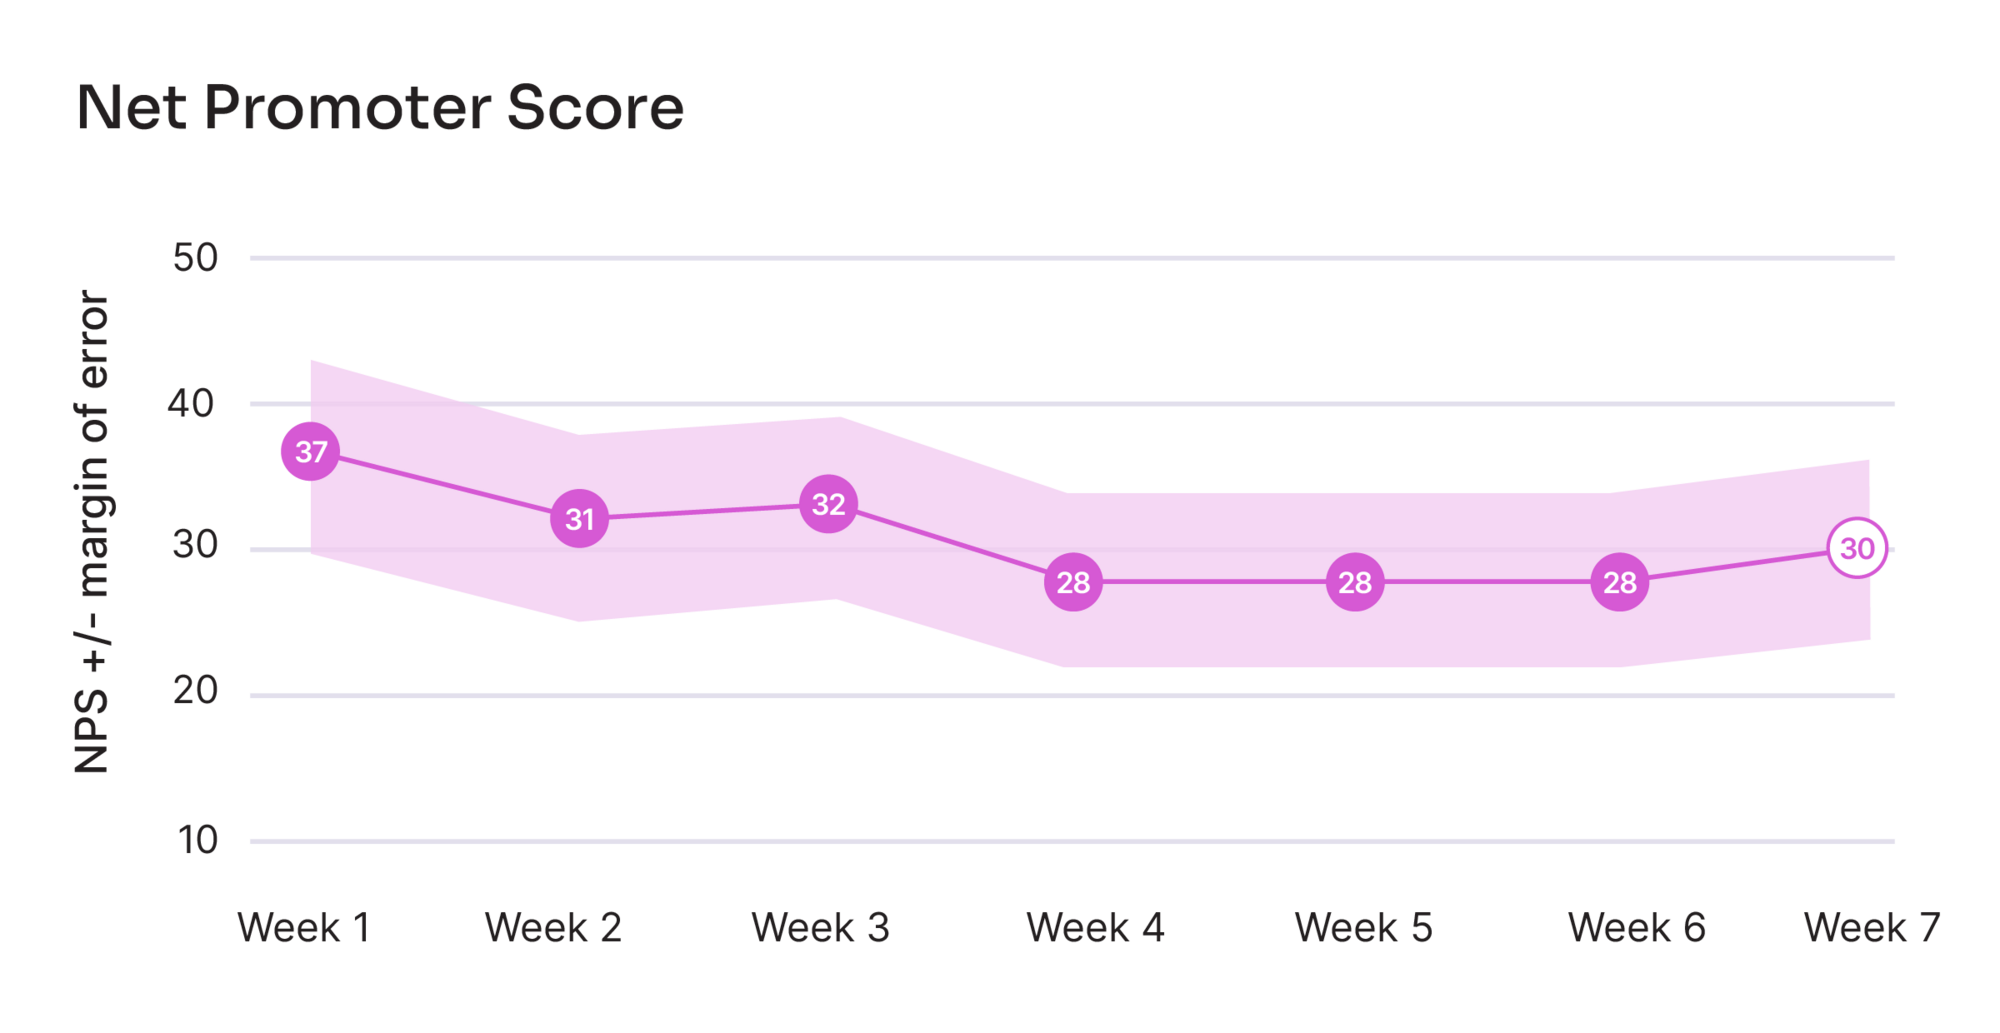
If a company has more Detractors than Promoters, they’ll quickly find that NPS can dip into negative territory. While not ideal, of course, it’s not uncommon to see a negative NPS. Because NPS scores vary greatly by vertical market, it’s important for companies to benchmark themselves against the most similar cohorts for which they can find data. It’s also important for companies to benchmark themselves against themselves, tracking NPS movement over time. Mapping changes in score to business events, like product changes and marketing campaigns, can help companies understand what developments impact customer satisfaction.
Tracking NPS calculation over time
What’s considered a good Net Promoter Score?
A good Net Promoter Score (NPS) varies by industry, but generally, a score above 0 is positive, indicating more promoters than detractors. Scores over 50 are excellent, showcasing strong customer loyalty, while scores above 70 are exceptional and rare.
Why NPS matters
Net Promoter Score (NPS) offers more than just a snapshot of current customer sentiment—it’s a powerful indicator of future business potential. When customers are willing to advocate for your brand, it speaks volumes about their satisfaction and loyalty, which directly impacts your long-term growth. While it’s natural to focus on boosting your NPS in the immediate term, it’s crucial to recognize that a consistently high NPS is not just a number; it’s a signal that your brand is building a loyal customer base that can drive sustained success. As you work to improve your score, keep in mind that the real value of NPS lies in its ability to predict and fuel long-term business growth.
What’s the difference between transactional vs. relational NPS programs?
Transactional NPS: Measures satisfaction after specific interactions, like purchases or support calls, offering immediate feedback on those experiences.
Relational NPS: Assesses overall customer loyalty periodically, providing insights into the long-term relationship and overall brand perception.
How should I utilize NPS data?
Utilize NPS data to analyze customer feedback, segment customers into promoters, passives, and detractors, and integrate these insights into your CRM. This helps identify trends, reduce churn, enhance customer experiences, and tailor marketing efforts.
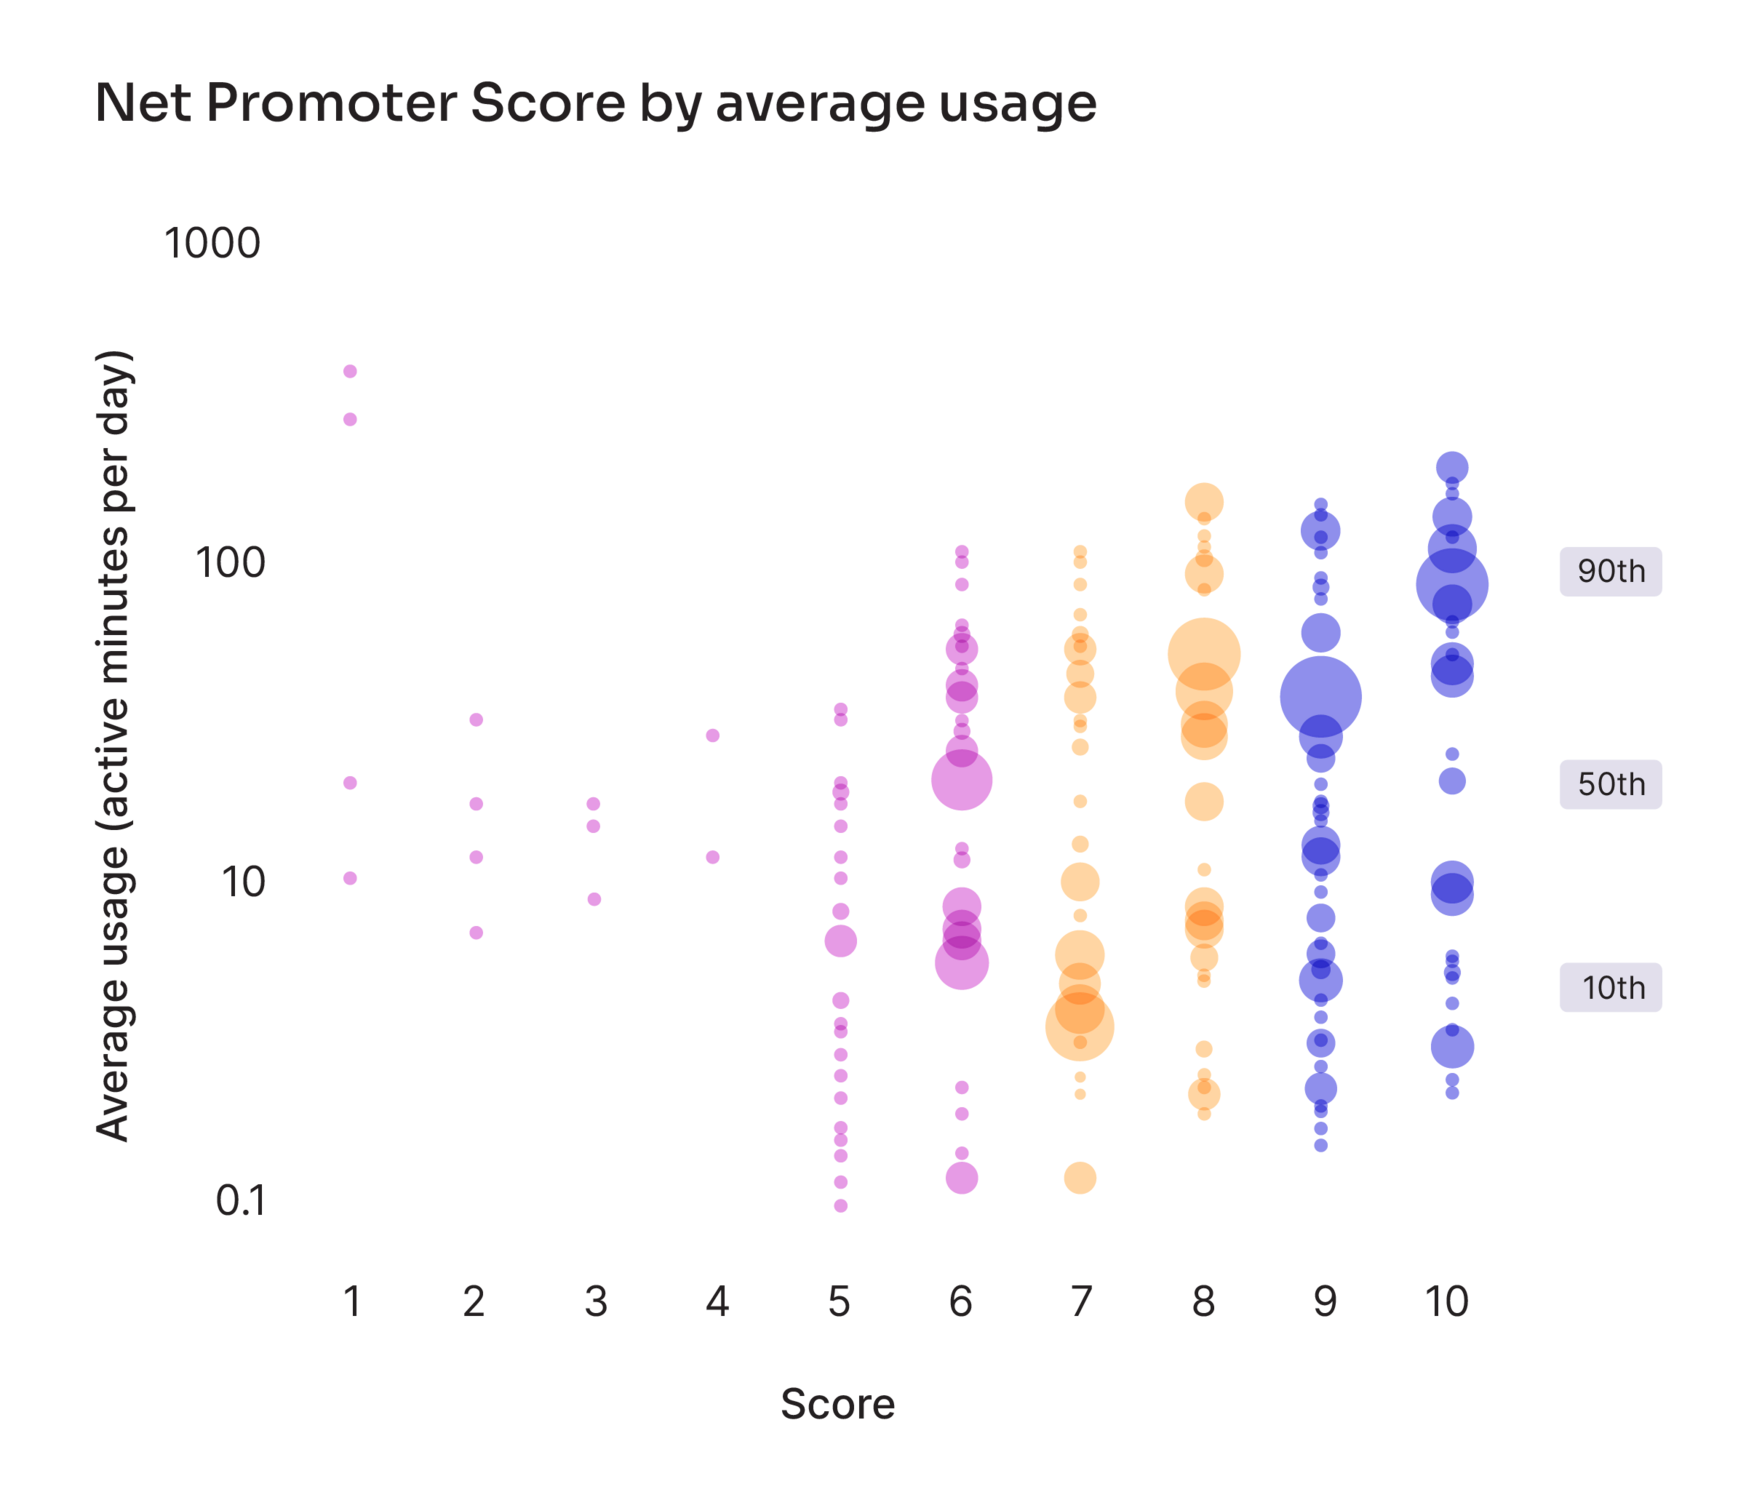
For example: Use your product analytics tool like Pendo Analytics to plot account-level NPS against product usage and account size to determine which customers may be at the highest risk of churn.
What are NPS survey best practices?
Keep it concise: Limit the survey to essential questions to avoid survey fatigue.
Make the timing optimal: Send surveys shortly after interactions or at regular intervals for relational NPS.
Act on feedback: Follow up with detractors to address issues and thank promoters for their support.
What is Employee Net Promoter Score (eNPS)?
Employee Net Promoter Score (eNPS) gauges employee loyalty by asking how likely they are to recommend their workplace to a friend. It helps measure employee satisfaction and highlights areas for organizational improvement in order to foster a better work environment.
What factors impact a company’s Net Promoter Score (NPS)?
It’s important, particularly for software companies, to understand the distinction between account-level NPS and user-level NPS. User NPS captures the score of the person who uses the software regularly. Because that individual is closest to the product, their score is likely higher than the account score, because the latter will be mitigated by less-informed perspectives of those who may be more distant from the product.
NPS tracking can get sophisticated quickly. The medium over which the score is captured can also bias results. An NPS survey conducted within the product itself is likely to produce a higher score than an emailed survey, because the former is capturing a higher concentration of active, engaged users.
None of this context is intended to suggest that user NPS or in-app NPS is more or less valuable than their counterparts. Only that it’s helpful to be aware of biases and to be consistent when benchmarking over time.
The method of collecting survey data isn’t the only factor that impacts an NPS score. The buying experience, onboarding process, and, of course, the product itself all have the potential to create Detractors and Promoters alike. To this end, understanding which pages or features in the product increase customer satisfaction and guiding users to those features is one of the most reliable ways to improve NPS over time. For example, Cision Trendkite found that depth of use had a significant impact on customer satisfaction–their Promoters used a much larger set of features in the application compared to Detractors and Passives.
How to design effective NPS surveys
Designing an NPS survey is about more than asking one question. The way you word the question, when you deliver it, and how you follow up determines whether the Net Promoter Score (NPS) is meaningful or misleading. Strong survey design increases accuracy and makes results actionable.
Sample NPS survey questions (good vs. bad)
Strong NPS survey design starts with neutral, clear wording. Leading questions bias results and reduce reliability.
Strong Wording
- “On a scale from 0–10, how likely are you to recommend [Product] to a colleague or friend?”
- “Would you recommend us because we provide the best service?”
Weak Wording
- “How likely are you to recommend [Product] to others?”
- “How satisfied are you with our great software?”
Best practices for NPS survey questions:
Keep the core question short and neutral.
Pair the score with an open-text follow-up (“What is the main reason for your score?”).
Run surveys at relevant moments: after onboarding, following major updates, or on a quarterly cycle.
Pendo enables teams to launch in-app NPS surveys that appear in the context of the product experience. This improves response rates and ensures feedback reflects the user’s actual journey.
How to measure NPS
Choosing the right NPS software is critical for turning customer feedback into actionable insights. While many NPS tools collect survey responses, what differentiates the most effective tools comes down to connecting responses to product usage and customer outcomes.
Most NPS tools deliver surveys by email or SMS and provide dashboards for basic reporting. These approaches work for surface-level insights but often miss the context of when and where customers interact with your product.
Why Pendo stands out
Pendo approaches NPS differently by embedding surveys directly inside the product experience. This in-app delivery increases response rates and ensures feedback reflects the user’s actual journey.
Pendo’s NPS software also allows teams to:
- Segment responses by product usage, customer cohort, or account attributes.
- Combine NPS feedback with product analytics to identify what features promoters and detractors use most.
- Track changes over time to see how product improvements affect loyalty.
- Share insights across product, success, and leadership teams to drive coordinated action.
Because Pendo integrates NPS results with behavioral data, teams can answer deeper questions: Which features improve sentiment? Where do detractors struggle? How do promoters differ from passives in adoption? This transforms NPS from a survey into a customer loyalty metric tied directly to product strategy and growth.
Implementation checklist for NPS success
Implementing NPS requires a structured approach. A clear process ensures reliable results and actionable insights.
Before the survey
Define your goal: retention improvement, churn prevention, or referral tracking.
Choose the type of survey: relationship NPS (ongoing loyalty) or transactional NPS (event-based).
Select your channel: in-app (via Pendo) or external (email, SMS).
During the survey
- Write a neutral NPS question.
- Include an open-text follow-up to capture reasons.
Target the right audience: new customers, active users, or long-term accounts.
After collecting results
- Segment into Promoters, Passives, and Detractors.
- Share findings across product, customer success, and leadership.
Act quickly: thank promoters, address detractors, and analyze themes.
Pendo automates this process. In-app surveys deliver higher participation. Analytics dashboards reveal why scores shift. Segmentation ensures actions are targeted and measurable.
NPS and business outcomes
Net Promoter Score is more than a survey result. When managed correctly, it is a leading indicator of growth, retention, and product adoption. Unlike lagging financial metrics, NPS reveals customer sentiment early, giving teams the chance to act before outcomes show up in revenue.
Retention and churn
- Detractors (scores 0–6) often signal early churn risk.
- Identifying them quickly allows customer success teams to intervene.
- Promoters (scores 9–10) renew more frequently and are less price-sensitive.
Expansion and referrals
- Promoters are more likely to expand their product use and adopt new features.
- They also generate organic growth through referrals and word-of-mouth advocacy.
- In SaaS, this directly lowers customer acquisition costs and boosts account expansion.
Benchmarks and industry growth
Research from Bain & Company shows that loyalty leaders—companies with the highest NPS in their industries—grow at more than twice the rate of their competitors. This positions NPS not just as a measure of customer experience, but as a proxy for long-term business health.
Why Pendo
Pendo connects NPS responses with product analytics, so organizations see why promoters or detractors feel the way they do. With in-app delivery, segmentation by behavior, and trend tracking over time, Pendo enables teams to:
- Correlate NPS with feature adoption and product usage.
- Prioritize roadmap decisions based on customer sentiment.
- Demonstrate how improving NPS links directly to churn reduction and revenue growth.
This integrated view transforms NPS from a score into a strategy for sustainable growth.
Where can I learn more about Net Promoter Scores?
For those looking to dig a little deeper, there are a number of books on the subject, beginning with the one that started it all: Fred Reichheld’s “The Ultimate Question” (which is now available as a 2.0 edition) as well as free resources on how to improve NPS score. There are premium NPS analytics and insights solutions and free NPS survey tools available and any number of websites that publish NPS benchmarks by industry.
