Must read
August 14, 2025
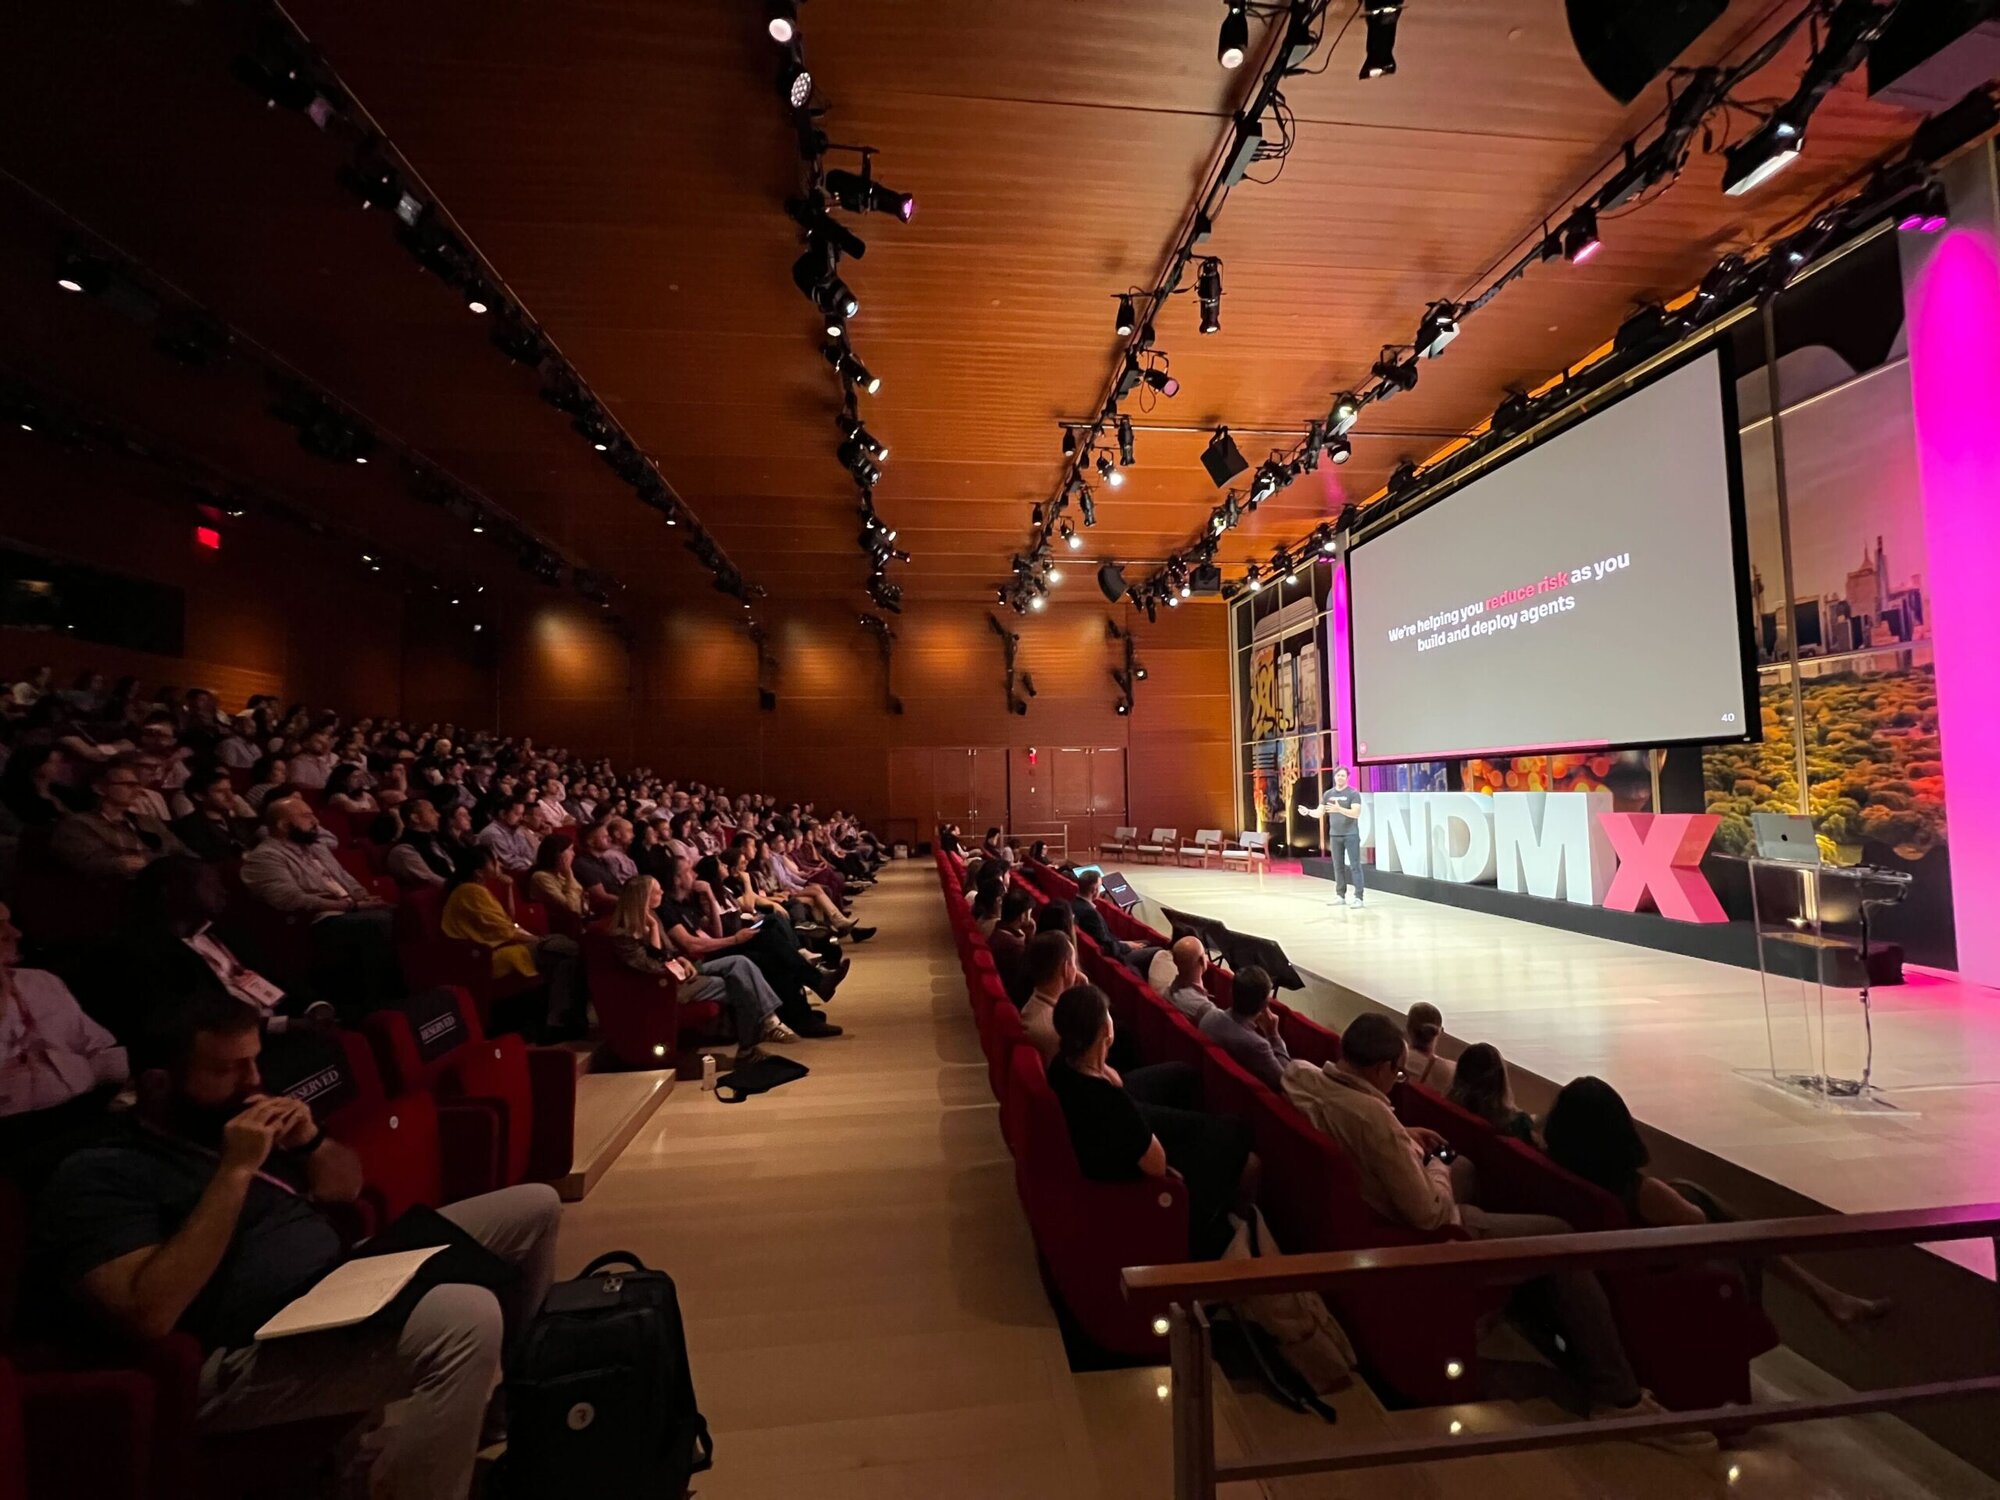
5 reasons we’re excited for INDUSTRY 2025: The Product Conference
Join us September 9-10th in in Cleveland, Ohio.
Read nowWatch now
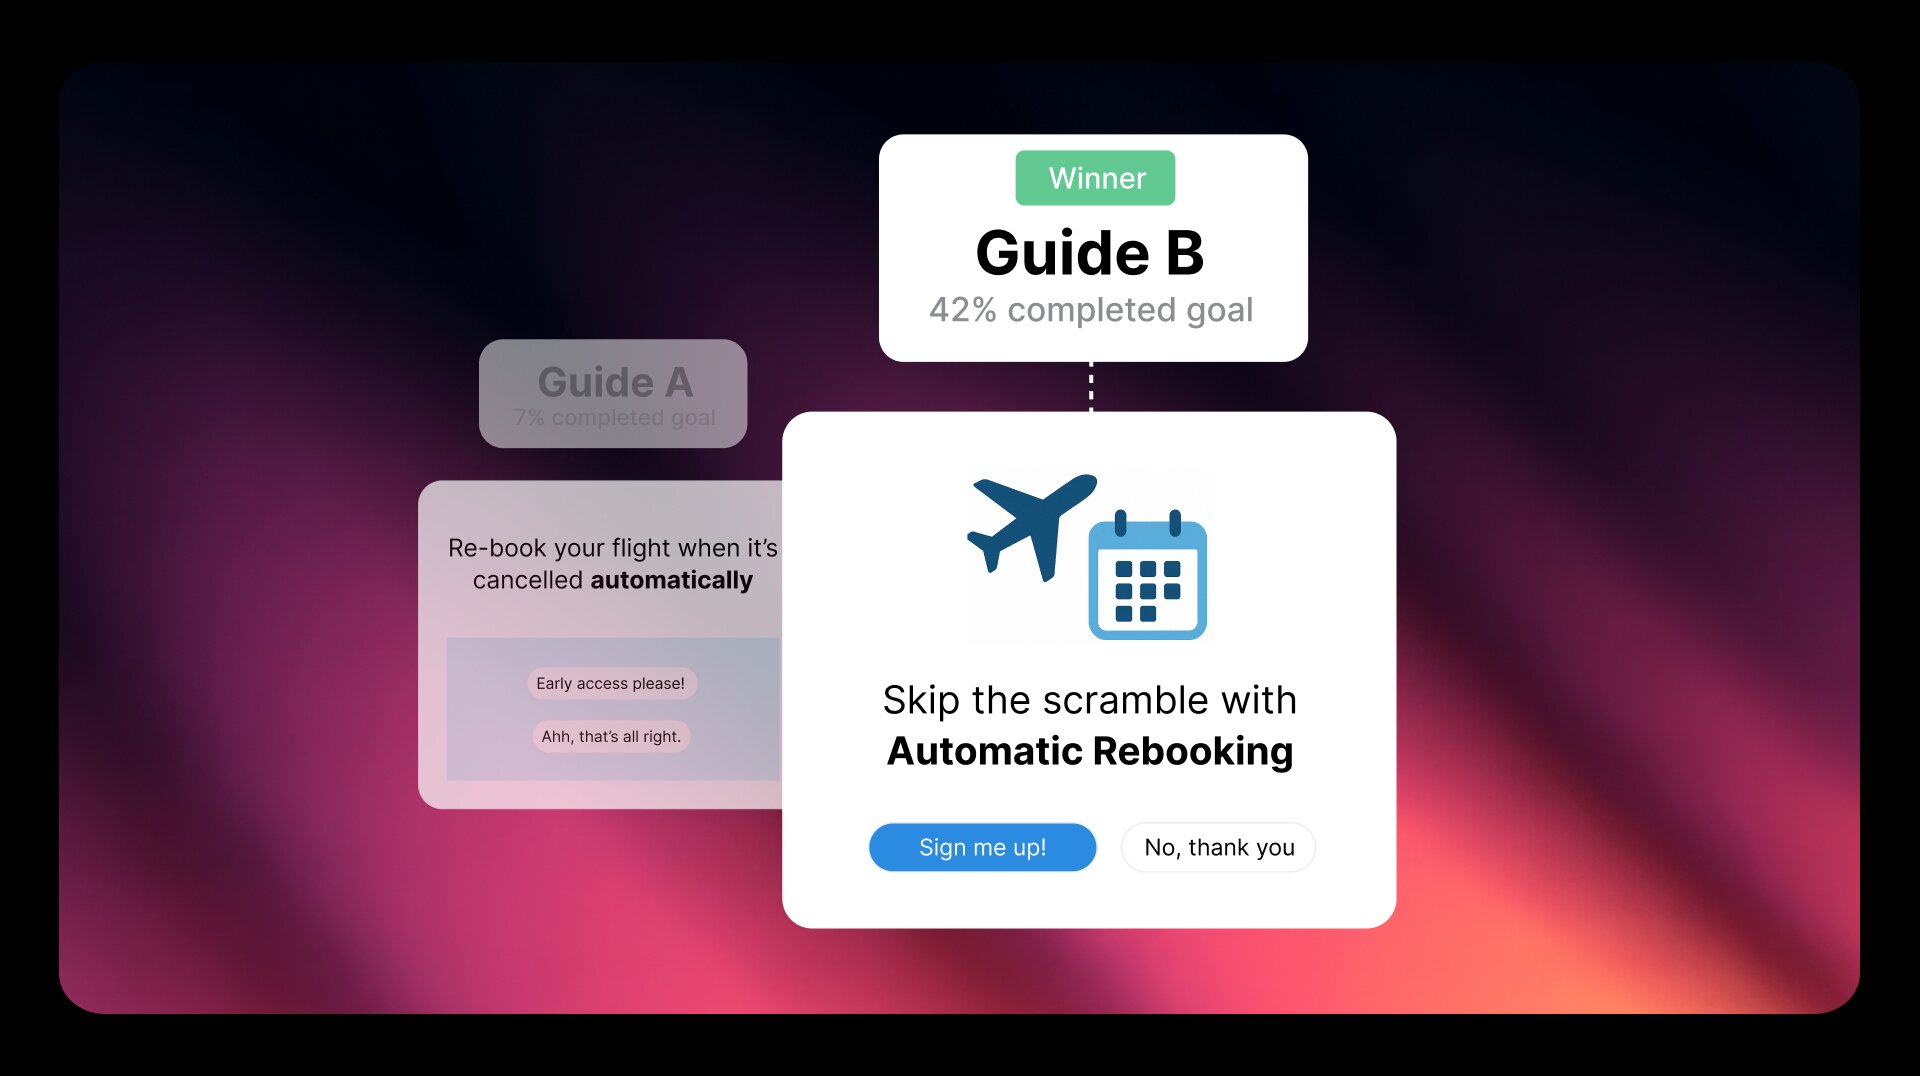
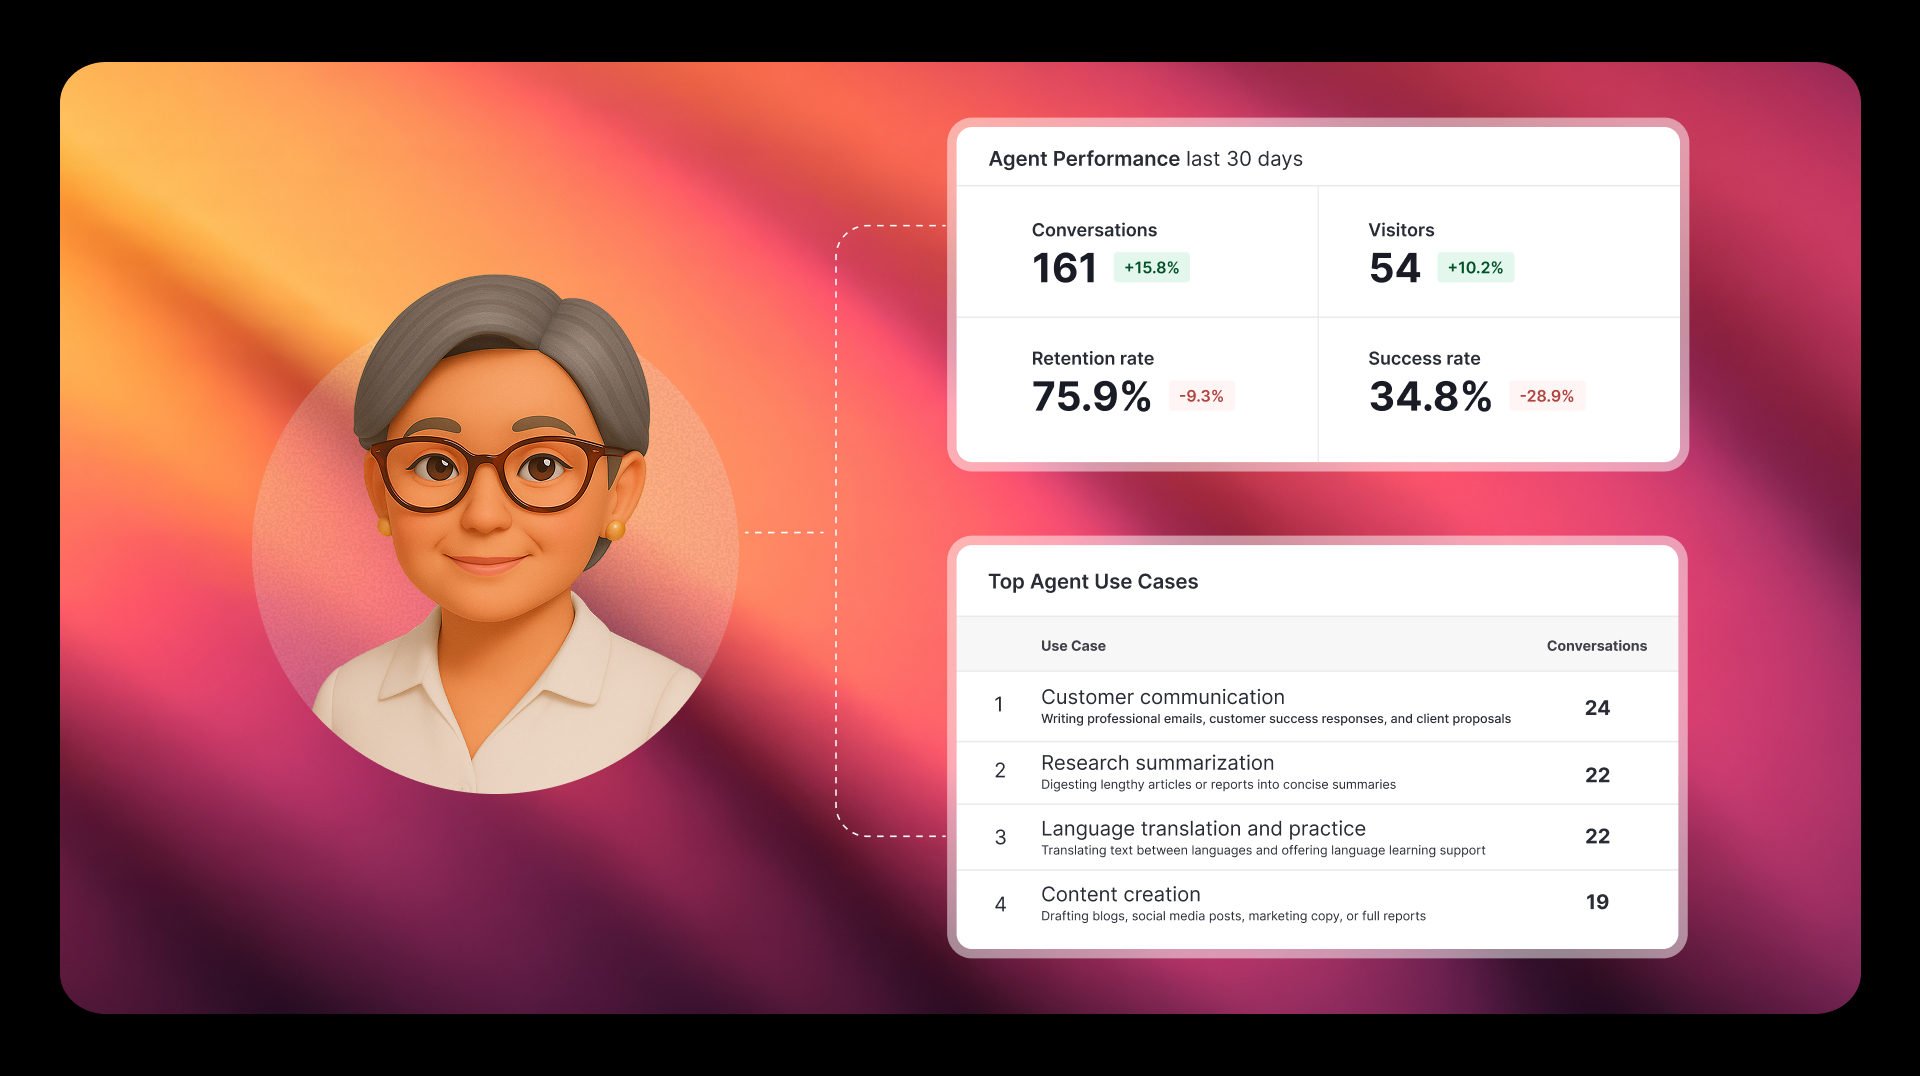
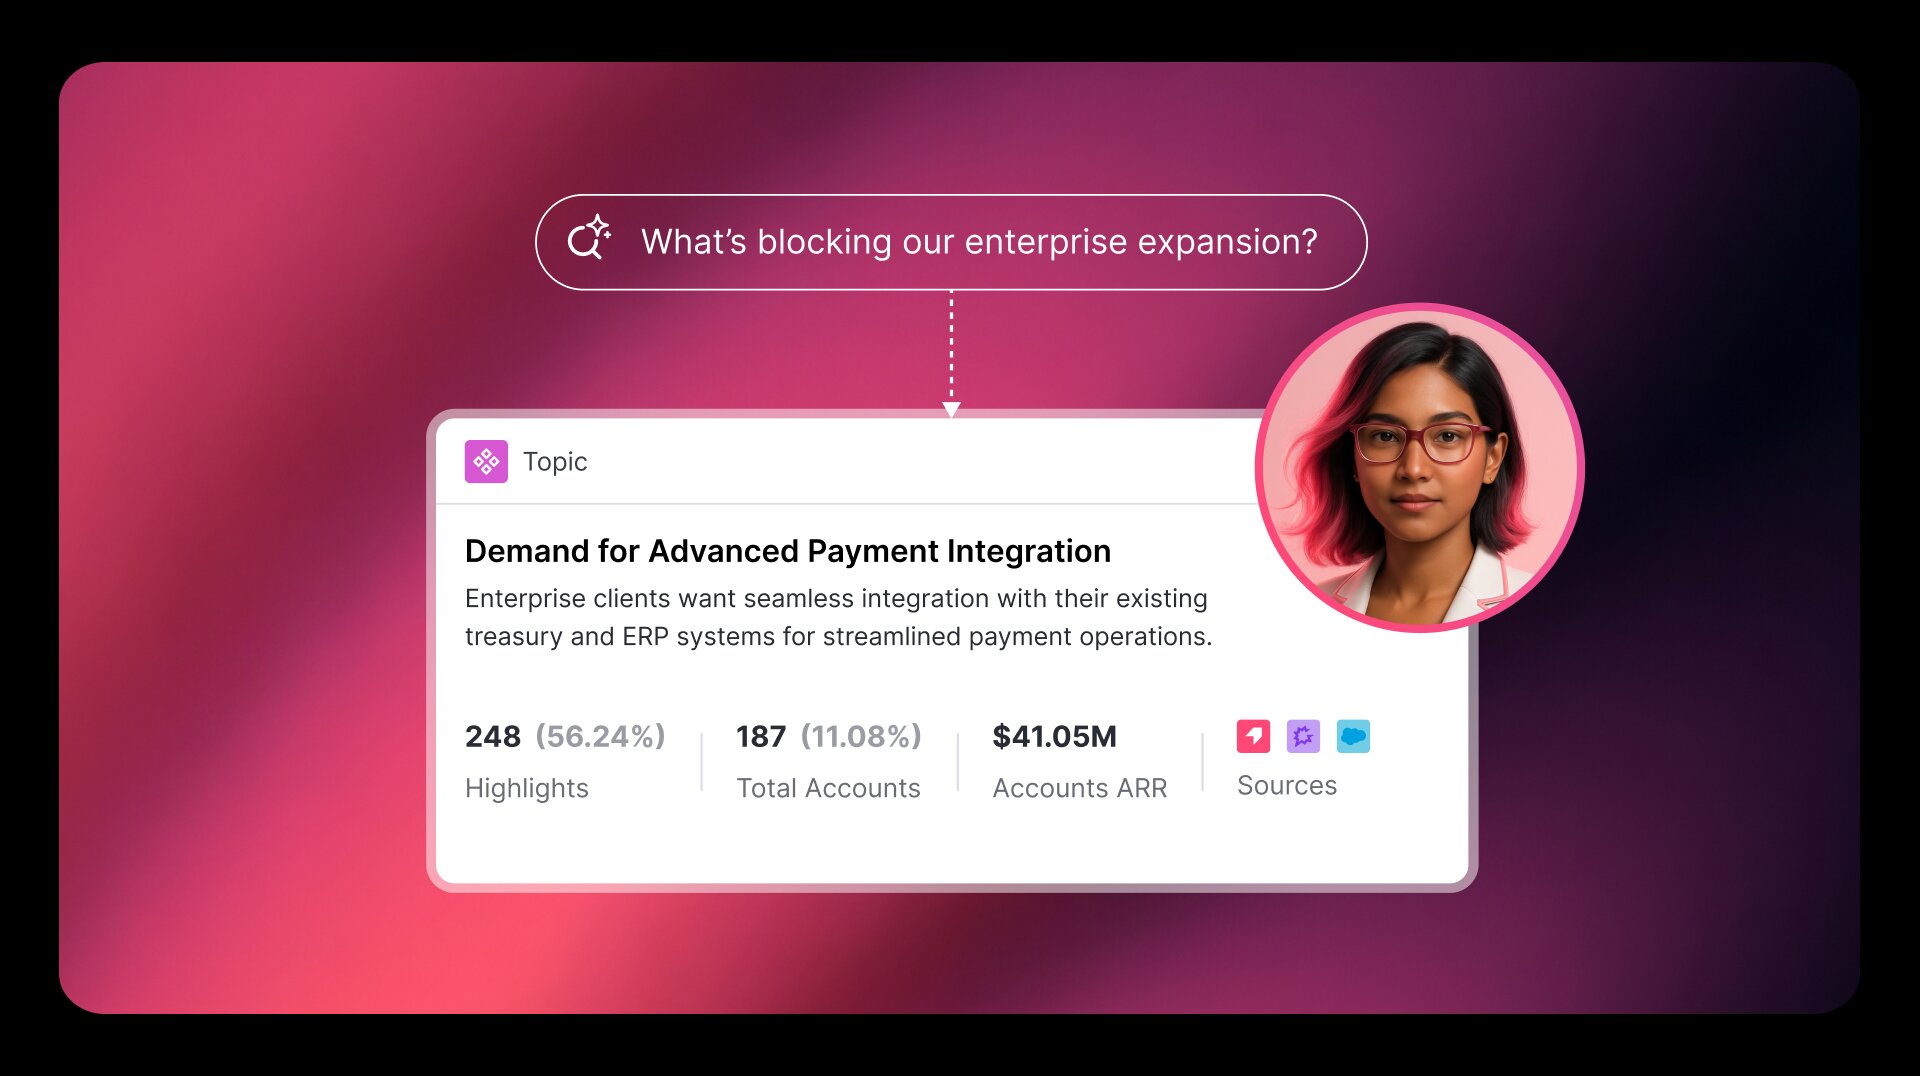
Do you know how your AI agents are performing?
Unless you can link agent usage to what happens next in your product, you can't tell if agents are working or not. But when your software and AI data live together, you can understand the full impact of your AI investments.
Read about itGet to know Pendo
See Pendo in action and learn how Pendo teams use our own product to optimize our customers' software experience.