Darrell Burgan is the vice president of development for Infor’s Human Capital Management software portfolio. He leads a global organization of developers, QA professionals, and business analysts focused on the delivery and the performance of the software. As a leader in HCM software, Infor develops HCM systems with the flexibility to adapt and grow with customers’ businesses while empowering organizational leaders with the critical tools and information they need to optimize the workforce and HR.
The Visibility Challenge
Like many software vendors, Infor supports a number of deployment options for their customers. These options have evolved as Infor’s portfolio has expanded, and as their customer requirements have changed. “I have seven key products that I have responsibility for,” says Darrell, “Our customers usually have a mix of these products, and they’re usually deployed in a number of ways. Some of the products are available as multi-tenant cloud only, some of these products are available as on-premise or single-tenant only, and one of the products is available across all three deployment options.”
The different types of deployments led to inconsistencies in visibility into usage and performance. “Prior to Pendo, we had reduced visibility into our on-prem installations from either a usage or an operational standpoint. Before our pivot to the cloud, the only way we knew there was an issue or problem on the client-side was when someone logged a support ticket. We have visibility into the single-tenant deployments, but aggregating information across all of them has been a challenge.”
Pendo’s ability to capture all user events independently of the back-end makes it a versatile tool for the Infor team. “That’s what makes Pendo so valuable,” said Darrell, “Because all of the tracking is on the client-side, it allows us to get complete visibility across all of the different client environments.”
Pairing Usage and Performance Data
Darrell admits that his approach to using Pendo is a bit unorthodox. “My use case is probably a bit different than most Pendo users in that we’re extracting additional data out of Pendo via the API to measure page load times in addition the standard usage data that Pendo shows in the interface. We use this performance information along with the daily usage volume to measure the health of each application across all the different deployments.”
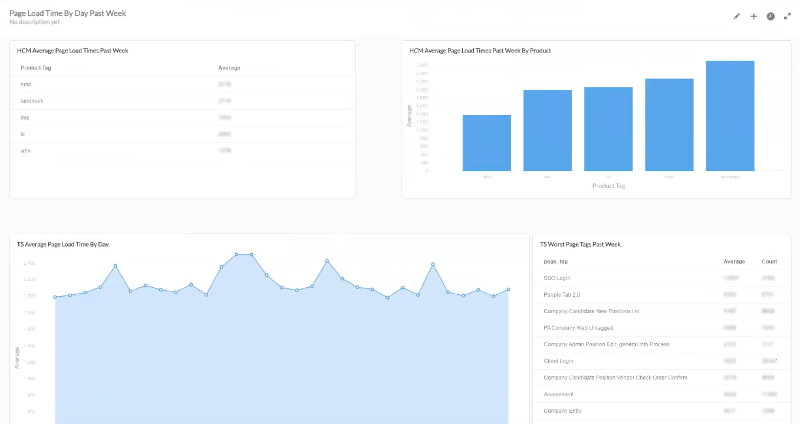
Infor’s custom dashboard pulls performance data via Pendo’s API
Infor HCM brings together the performance data with Pendo’s other usage analytics in a custom report that allows his team to measure the health of their applications across several different dimensions. “We aggregate the data at the application level, but can quickly drill into the client-level or even the page-level within that client if we are investigating a specific support issue.”
Proactive Outreach
“Ultimately for us it’s about being proactive,” said Darrell, “Being proactive with our customers, and with our products themselves. This is why the performance data is such an important part of the mix for us. We review the application performance at our weekly operations meeting to guide which clients we want to reach out to.” With Pendo, the Infor team has the ability to engage with clients before they report a performance issues. “It’s great to be able to address customer issues this way. Very few companies at our size and scale can get ahead of the curve on things like this.”
Infor segments the data by support teams to ensure that each team has visibility into how their clients are doing. “Our company has grown by acquisition so we have a number of different support teams that we interact with. Using Pendo we can segment the data that we pull by team so that we’re only sharing information that is relevant to the products and customers they support.”
The data also helps the Infor team prioritize product updates. “We look at the data by application, by individual customer, and at the page level. So within an application, we can look at distinct pages, see which ones are getting the most hits, and what the average load time for the page is. So, we can also be proactive with our products. We can go back to our development teams and say ‘here are the 5 top things you need to look at for this product’. Then we can track the data to see if the issue is getting addressed.”
Communicating with Product Data
“The data that we’re capturing with Pendo is really helpful when we’re communicating with customers,” said Darrell “One of our larger customers was worried about our ability to handle a deployment at their scale. Using the data, we were able to show them that their usage volume wasn’t significantly larger than our other large accounts. Even more importantly, we were able to share the performance data with them over time, showing them how we were improving their response times.”
“Anytime we see a particular client that is having performance that doesn’t seem correct, we go into the Pendo data and start looking at more detail into their activities. We see if we can pinpoint any user behavior, whether that’s increased load on particular pages and features, or a spike in users that might be causing the changes in performance.”
The data has had additional implications for the Infor team beyond customer support and product development. “I was surprised by some of the things I saw once I was able to get comprehensive visibility into the product usage, said Darrell, “Some of my assumptions about which were our most used products were off by a factor of 2 to 3. We were also able to compare revenue growth to usage growth. The data showed us that one product in particular was really high on volume and hosting costs, but was near the bottom in revenue generation. This allowed us to re-think some of our pricing and go-to-market strategies.”


