We’ve all interacted with a software product that didn’t live up to its promises. From mis-set expectations to poorly placed paywalls, users leave software for many reasons. And because user retention varies between industry, region, and company size, it’s hard to know if your software is keeping an adequate amount of users—or if you’re losing more than your peers.
If you can’t keep customers, it hurts your company’s revenue. Deliver a digital experience that keeps your users engaged with your software for the long haul, and your customers will be happier, more likely to stick around, and even become advocates.
User retention vs. customer retention
There are two types of retention: User retention and customer retention. While user retention and customer retention sound similar, they’re measuring two different things.
- User retention measures how many first-time visitors or accounts return to your software during a window of time.
- Customer retention measures how many accounts return to your software over a period of time, regardless of how many of those accounts’ employees return to your software.
While user retention and customer retention sound similar, they’re measuring two different things. For B2C companies, user and customer retention are often interchangeable. But for B2B companies, it’s a signal of how satisfied your customers are by financially committing to your software. In this blog, we look at user retention as an indicator of end-user satisfaction.
How to measure your user retention rate
At Pendo, we measure user retention by counting a software’s total number of new visitors, and if they returned in month one, two, and three after the month of their first visit. If a user first visits your software, we see if they return within 30 days (month one), 30 to 60 days (month two), or 60 to 90 days (month three).
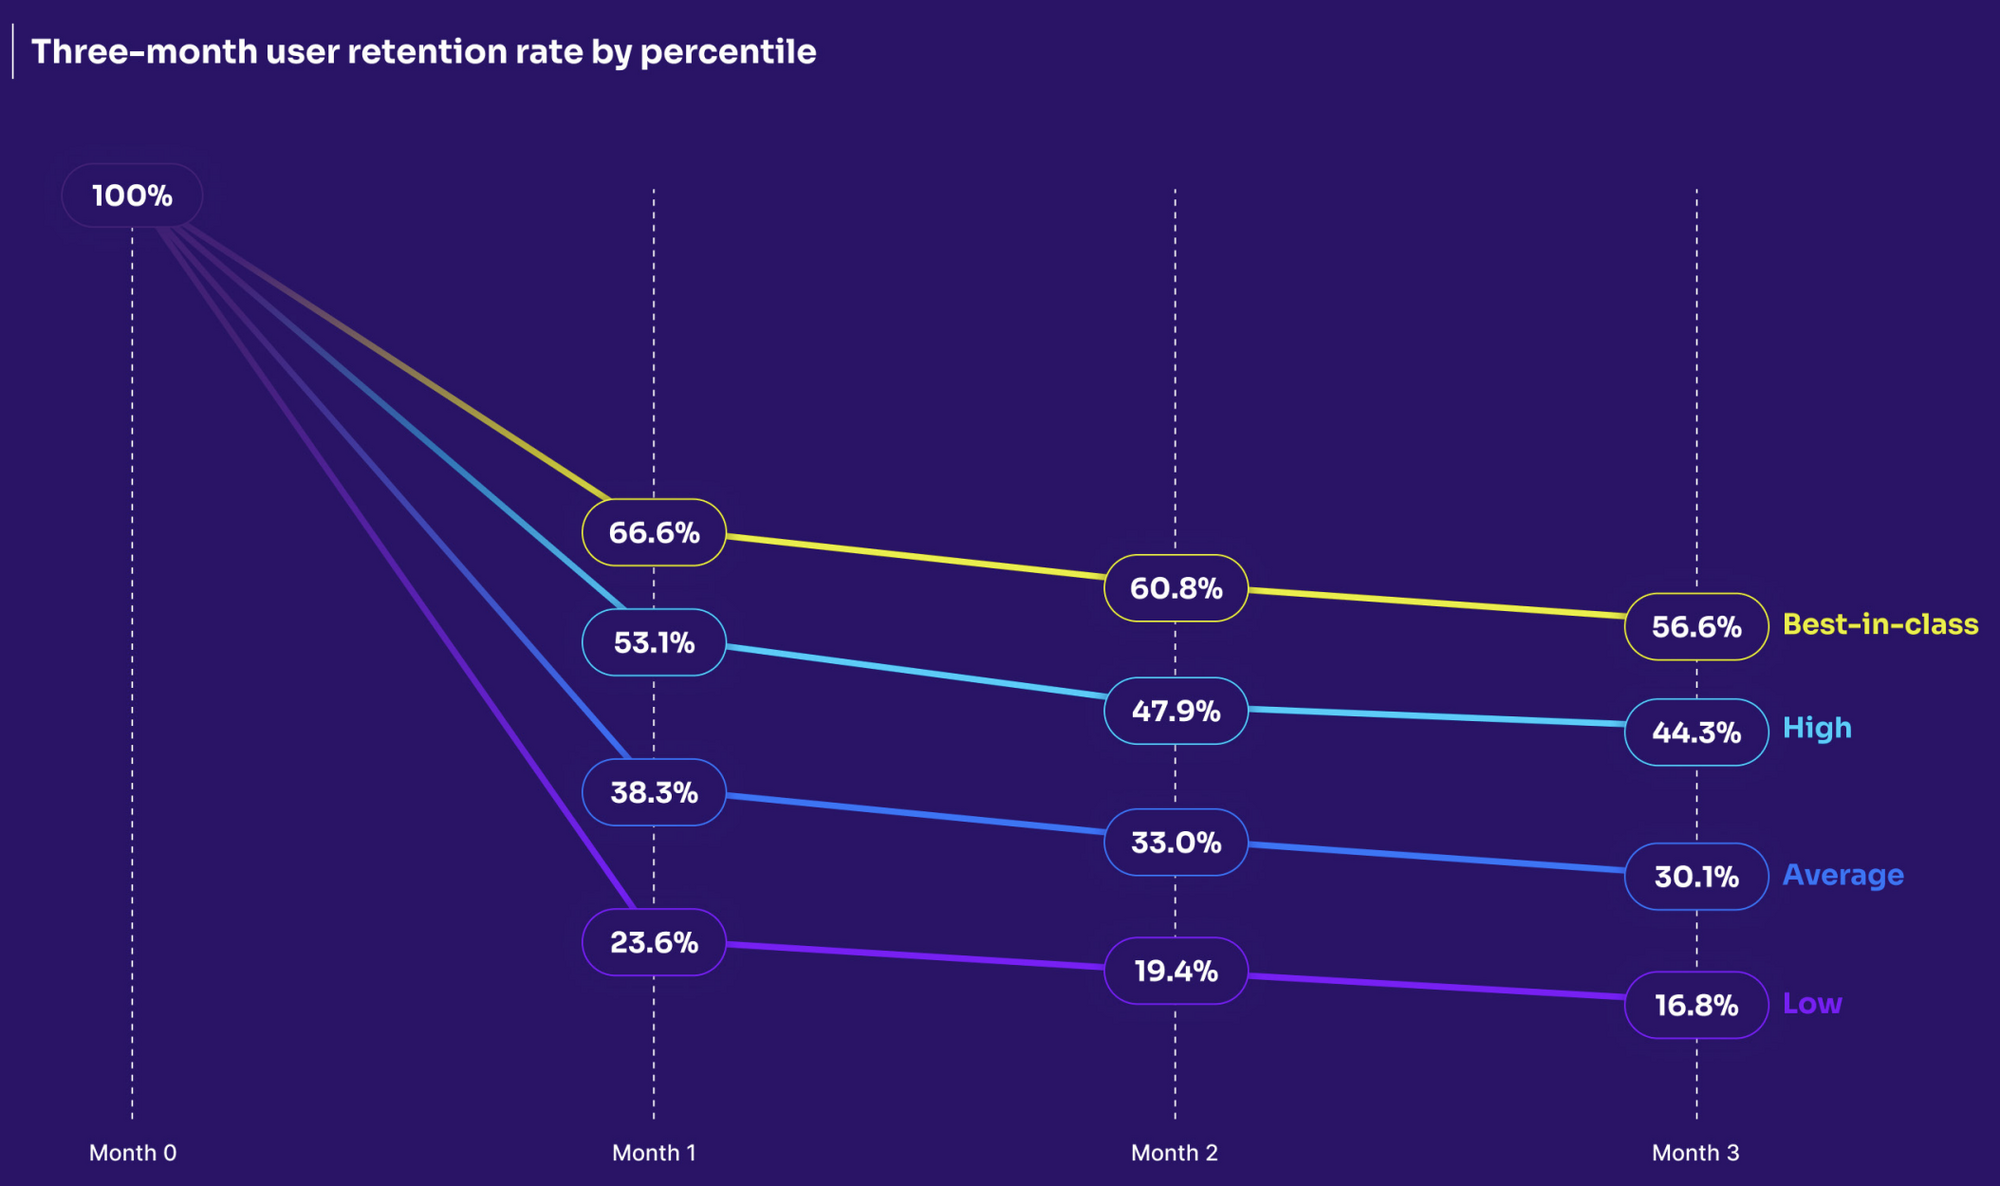
We categorized retention into four buckets: Low (25th percentile), Average (50th percentile), High (75th percentile), and Best-in-class (90th percentile).
Over three months, software products lose 70% of users
Software keep 39% of users after one month, on average. After three months, about 30% of users are still returning to the software. For every 100 active users you add, 30 will stick around after three months.
For a new software product, a one-month retention rate of 39% indicates that your software adds value to users. For an established enterprise software, a 39% user retention rate might reveal underlying functionality issues.
The top 10% of software products retain 1.7x as many customers in month one, 1.8x customers in month two, and 1.9x customers in month three, than average.
Enterprise software investments only pay off when users adopt and get value from the tools.
Manufacturing and Consumer Goods have the highest user retention rate
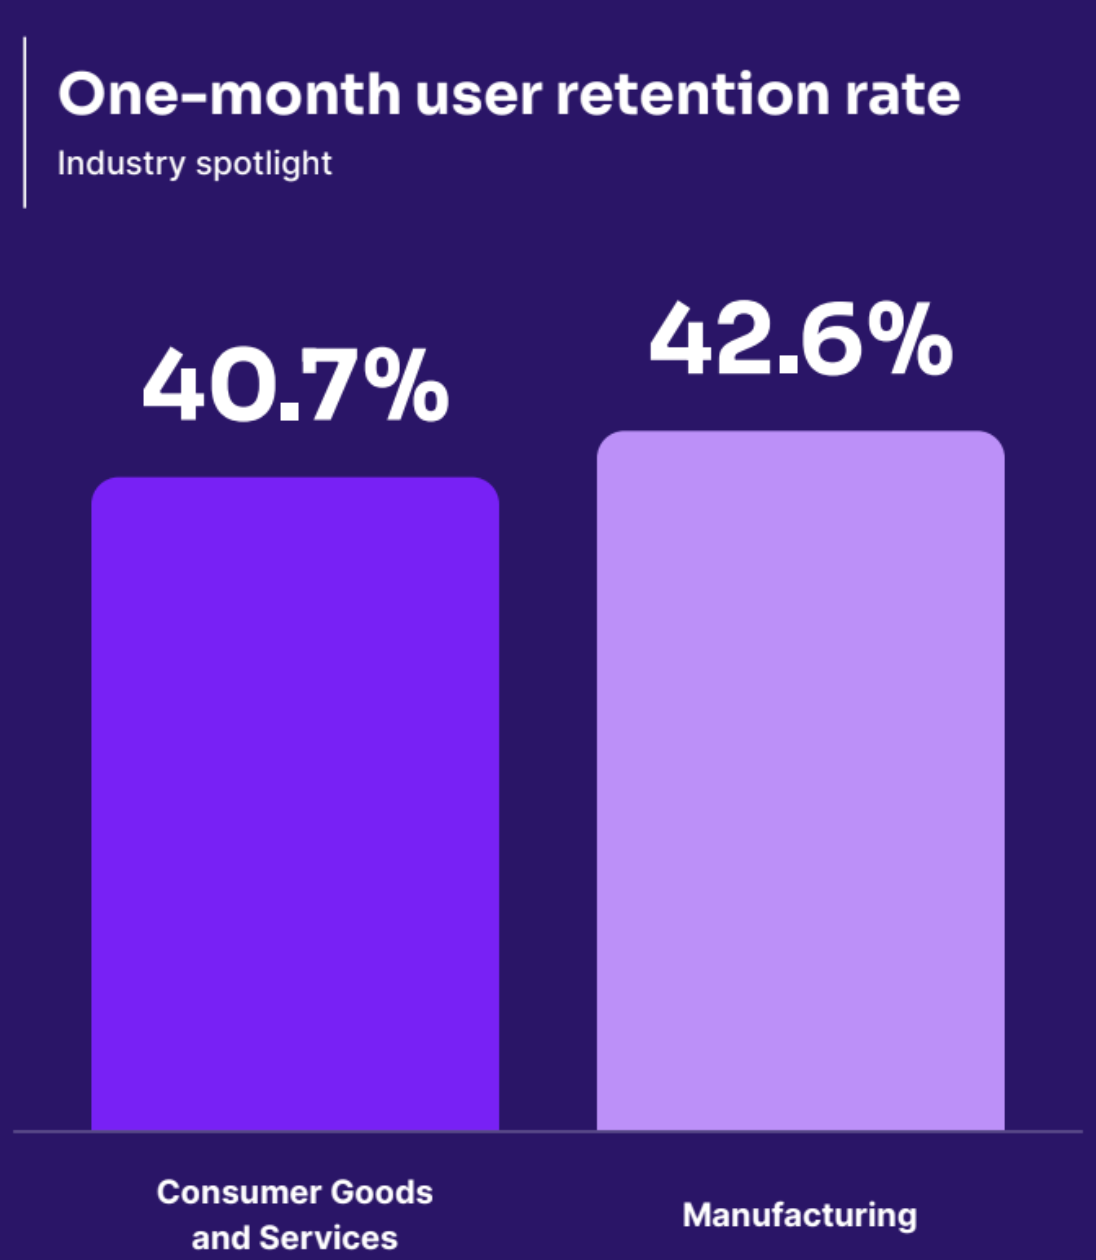
Industry has a major impact on your softwaren’s user retention. Manufacturing is in the lead, followed closely by Consumer Goods and Media. Software in the Financial and Government sectors are having the hardest time bringing customers back after one month.
If your app is a B2C free game, a user retention rate of 40% means users are finding your software enjoyable. However, for a communications app designed for daily use, a 40% user retention rate may signal potential issues.
Users stick around more with smaller companies
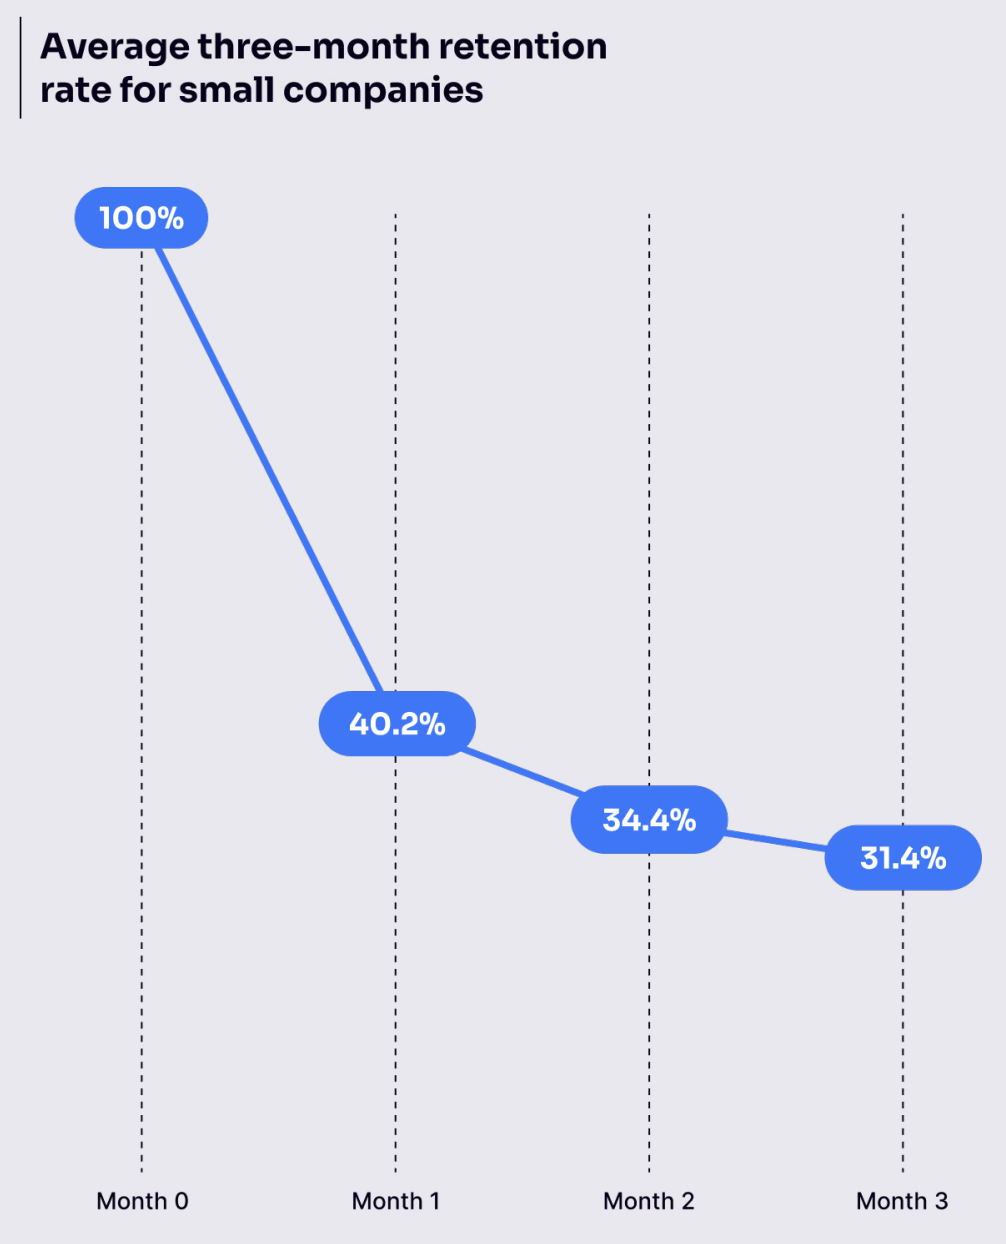
Companies with fewer than 200 employees have higher user retention on average after month one and two. But after month three, companies with over 2,500+ employees win. After one month, small companies retain 40 customers for every 100. In month two, they retain 34. In month three, they retain an average of 16.7 users.
Tips to improve your user retention rate
Retention should be more than a metric—it should be a mindset. To improve this, follow these best practices:
- Simplify and automate new user onboarding: When a new user logs into your software, highlight your core features, offer in-app walkthroughs, and link to your resource center. See how five product teams are improving onboarding.
- Continue to add value: Nurture customer relationships even after they’ve gotten the hang of your application. Create an in-app and out-of-app messaging strategy to create a software environment where users are always learning and uncovering features, at their own pace. Here are 12 product communication do’s and don’ts.
Deepen your product analytics skills and expertise.
Take the Product Analytics Certification Course
- Put your product analytics to work: You can’t improve retention without defining the problems. Look at your product’s qualitative, quantitative, and visual data across different user segments. Session replay, product analytics, and feedback capture tell you what your top users are doing so you can guide at-risk customers to value.
- Review retention data on a regular cadence in team meetings. Create dashboards that are easily accessible and visible to everyone. Celebrate retention wins. Make retention a part of your product development process. If a team improves a feature that significantly boosts retention, acknowledge it. These habits keep everyone aligned and focused on what matters most: delivering value that keeps users coming back.
User retention varies greatly depending on industry, region, and company size. Use our interactive benchmarking tool to see how your peers are retaining users.
We’ve all interacted with a software product that didn’t live up to its promises. From mis-set expectations to poorly placed paywalls, users leave software for many reasons. And because user retention varies between industry, region, and company size, it’s hard to know if your software is keeping an adequate amount of users—or if you’re losing more than your peers.
If you can’t keep customers, it hurts your company’s revenue. Deliver a digital experience that keeps your users engaged with your software for the long haul, and your customers will be happier, more likely to stick around, and even become advocates.
User retention vs. customer retention
There are two types of retention: User retention and customer retention. While user retention and customer retention sound similar, they’re measuring two different things.
- User retention measures how many first-time visitors or accounts return to your software during a window of time.
- Customer retention measures how many accounts return to your software over a period of time, regardless of how many of those accounts’ employees return to your software.
While user retention and customer retention sound similar, they’re measuring two different things. For B2C companies, user and customer retention are often interchangeable. But for B2B companies, it’s a signal of how satisfied your customers are by financially committing to your software. In this blog, we look at user retention as an indicator of end-user satisfaction.
How to measure your user retention rate
At Pendo, we measure user retention by counting a software’s total number of new visitors, and if they returned in month one, two, and three after the month of their first visit. If a user first visits your software, we see if they return within 30 days (month one), 30 to 60 days (month two), or 60 to 90 days (month three).
We categorized retention into four buckets: Low (25th percentile), Average (50th percentile), High (75th percentile), and Best-in-class (90th percentile).
Over three months, software products lose 70% of users
Software keep 39% of users after one month, on average. After three months, about 30% of users are still returning to the software. For every 100 active users you add, 30 will stick around after three months.
For a new software product, a one-month retention rate of 39% indicates that your software adds value to users. For an established enterprise software, a 39% user retention rate might reveal underlying functionality issues.
The top 10% of software products retain 1.7x as many customers in month one, 1.8x customers in month two, and 1.9x customers in month three, than average.
Manufacturing and Consumer Goods have the highest user retention rate
Industry has a major impact on your softwaren’s user retention. Manufacturing is in the lead, followed closely by Consumer Goods and Media. Software in the Financial and Government sectors are having the hardest time bringing customers back after one month.
If your app is a B2C free game, a user retention rate of 40% means users are finding your software enjoyable. However, for a communications app designed for daily use, a 40% user retention rate may signal potential issues.
Users stick around more with smaller companies
Companies with fewer than 200 employees have higher user retention on average after month one and two. But after month three, companies with over 2,500+ employees win. After one month, small companies retain 40 customers for every 100. In month two, they retain 34. In month three, they retain an average of 16.7 users.
Tips to improve your user retention rate
Retention should be more than a metric—it should be a mindset. To improve this, follow these best practices:
- Simplify and automate new user onboarding: When a new user logs into your software, highlight your core features, offer in-app walkthroughs, and link to your resource center. See how five product teams are improving onboarding.
- Continue to add value: Nurture customer relationships even after they’ve gotten the hang of your application. Create an in-app and out-of-app messaging strategy to create a software environment where users are always learning and uncovering features, at their own pace. Here are 12 product communication do’s and don’ts.
Deepen your product analytics skills and expertise.
Take the Product Analytics Certification Course
- Put your product analytics to work: You can’t improve retention without defining the problems. Look at your product’s qualitative, quantitative, and visual data across different user segments. Session replay, product analytics, and feedback capture tell you what your top users are doing so you can guide at-risk customers to value.
- Review retention data on a regular cadence in team meetings. Create dashboards that are easily accessible and visible to everyone. Celebrate retention wins. Make retention a part of your product development process. If a team improves a feature that significantly boosts retention, acknowledge it. These habits keep everyone aligned and focused on what matters most: delivering value that keeps users coming back.
User retention varies greatly depending on industry, region, and company size. Use our interactive benchmarking tool to see how your peers are retaining users.


![[object Object]](https://cdn.builder.io/api/v1/image/assets%2F6a96e08774184353b3aa88032e406411%2F39f3ccde352b460cbf348ccc952054cd?format=webp)


